Process Monitor Guide
Overview
Process Monitor is a tool that allows you to see resource utilization in real time. Using Process Monitor you can get real-time information about the file system, registry, processes/threads.
Starting Process Monitor
To start Process Monitor, double click on the Process Monitor link on your desktop.
When you start Process Monitor, you will probably start seeing a lot of data accumulating really fast. To pause data collection, click on the magnifying glass icon, third in from the left or hit Ctrl+E. To clear the events in the events window click the eraser icon, fifth in from the left, or hit Ctrl+X.
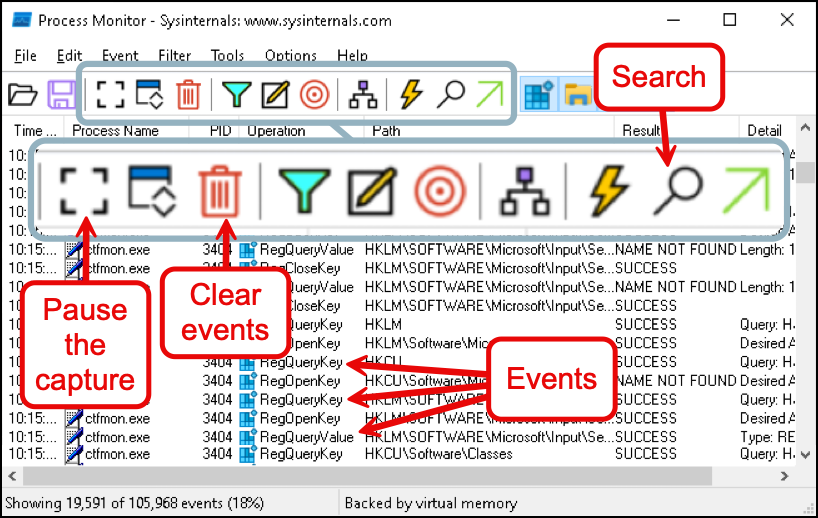
You can also search through the events by clicking on the binoculars, 10th in from the left, or hit Ctrl+F.
Event Details
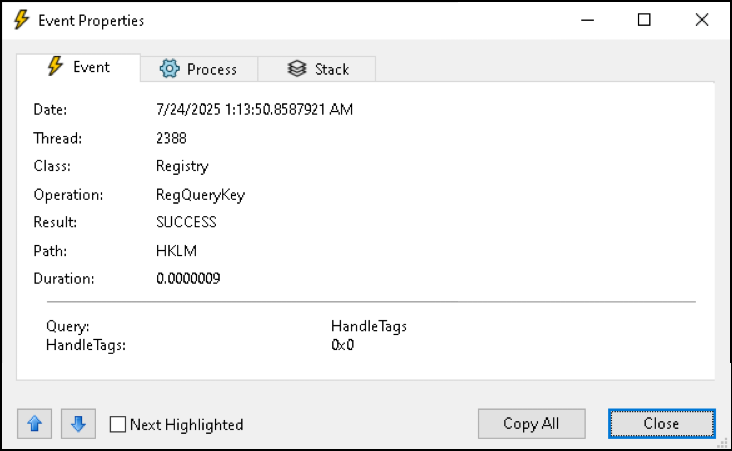
To get more details about any of the events, double-click on it. Alternatively you can single left-click to select the event and then hit Ctrl+P+`. Finally, you can also right-click on an event and select Properties.
When you display event properties (details) you'll get a popup window showing you more information.
Process Tree
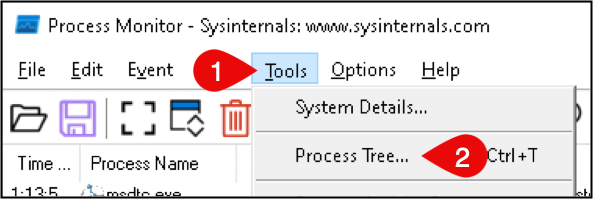
One way to get a quick summary of the subprocesses that were spawned is to use the process tree. To see the process tree click Tools > Process Tree or hit Ctrl+T.
Once you've done this, the pop up window makes it easy to get an idea of what is going on process-wise. If you want more details about a particular process, left-click on it.

To jump to the first event for the process in the main view, double-click on the process in the Process Tree pop up.
Reducing the Output
Since Process Monitor gathers more data than Google, you'll need to spend some time configuring it to hide and/or drop the things you don't care about. There are a couple of major options for reducing the amount of cruft to sift through.
Resource Categories
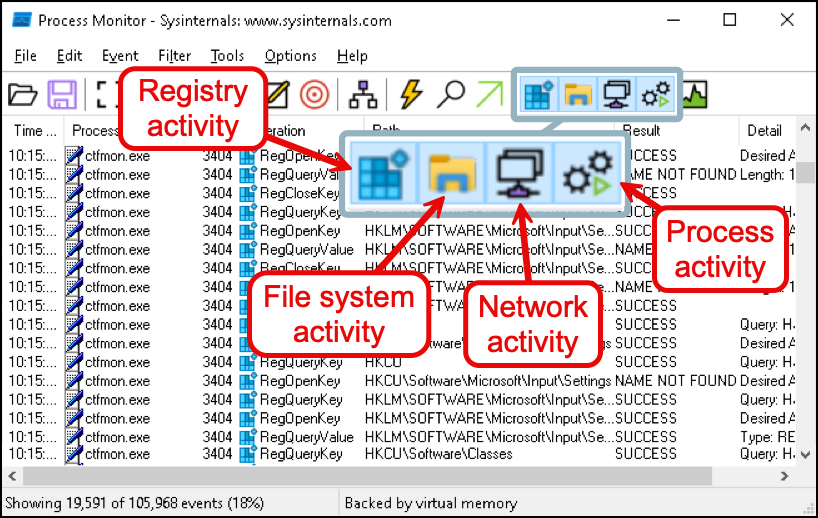
On the Process Monitor toolbar, you'll see four buttons that describe the categories of activity Process Monitor will display. The categories are (in order from left to right):
- Registry activity
- File system activity
- Network activity
- Process activity
Process Monitor Filters
The other major way to filter events is to use Process Monitor filters. These are an effective way to separate the noise you usually don't care about, from the things that will help you get your job done (like the events related to malware).
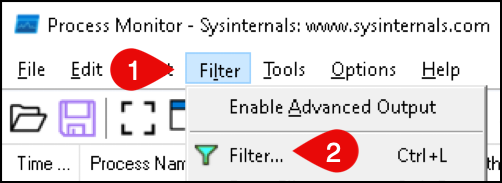
To get to the filters select the Filter menu, and then select Filter. Or you can hit +Ctrl+L.
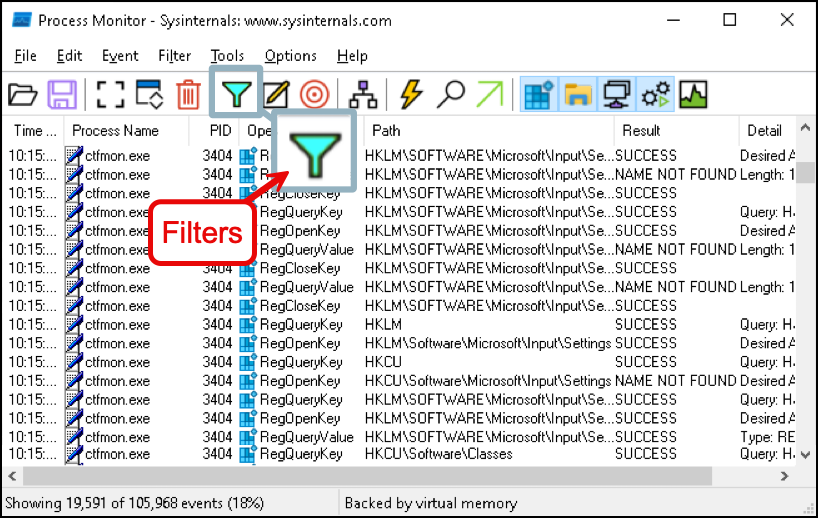
Alternatively you can also click on the filter icon, which looks like a funnel and is the sixth button from the left.
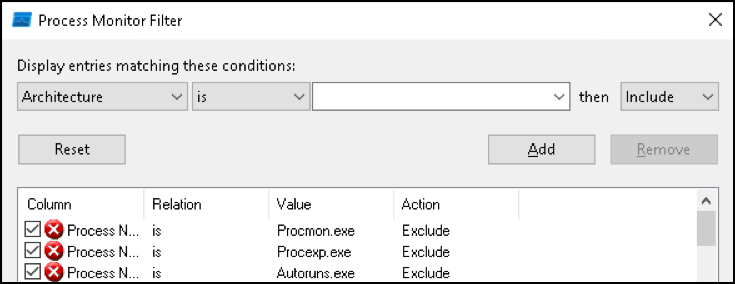
The filter window shows you the filters that you currently have. To remove (delete) a filter select it and click on the remove button.
To add a filter, select the column, relation, value, and actions and then click the add button, which is just to the left of the remove button.
The possible values for column are:
- Architecture
- Authentication ID
- Category
- Command Line
- Company
- Completion Time
- Date & Time
- Description
- Detail
- Duration
- Event Class
- Image Path (this is useful)
- Integrity
- Operation
- Parent PID (Parent Process ID)
- Process Name
- Relative Time
- Result
- Sequence number
- Session
- TID (Thread ID)
- Time of Day
- User
- Version
- Virtualized
The possible values for the relation column are:
- is
- is not
- less than
- more than
- begins with
- ends with
- contains
- excludes
The possible values for the action column are:
- Include
- Exclude (usually what you want)
The quickest way to create a filter based on a particular event is to right click on the event, then select Exclude (or Include) and then the field (column) you want to exclude (or include).

False Negatives
Realize that adding filters while nice, can miss malware that injects itself into a process that you've added to an exclude filter.
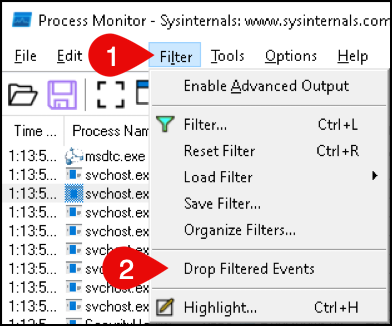
Dropping Filtered Events
By default, events that are filtered are still kept track of. Meaning if you were to clear the filters you would see the events again. However since Process Monitor excels at collecting absurd amounts of data, it can quickly bog down your system. To deal with this, if you select the Filter menu, and then Drop Filtered Events, Process Monitor will just drop (as opposed to hide) the events that get excluded by the filters.